
Draft submitted by Standard 8 Committee: Rachael Barlow (chair), Sharon Castonguay, Jennifer Rose, Nicole Stanton, Stephanie Weiner, Michael Whitcomb
Additional Contributors: Gloster Aaron (WesMaSS), Steve Angle (Fries), Demetrius Colvin (Resource Center), Beth Hepford (Shapiro), Mary Alice Haddad (CEAS), Crystal Hill (Accessibility), Barbara Juhasz (NS&B), Manolis Kaparakis (QAC). Ethan Kleinberg (History), Jim Kubat (Gordon Career Center), Jill Livingston (Library), Sean McCann (Calderwood), Chia-Ying Pan (International Student Affairs), Laura Patey (Student Affairs), Nancy Putnam (Library), Lauren Silber (Shapiro), Michael Whaley (Student Affairs), Takeshi Watanabe (CEAS), David Westmoreland (Chemistry), Andrew White (Library).
Standard Eight: The institution demonstrates its effectiveness by ensuring satisfactory levels of student achievement on mission-appropriate student outcomes. Based on verifiable information, the institution understands what its students have gained as a result of their education and has useful evidence about the success of its recent graduates. This information is used for planning and improvement, resource allocation, and to inform the public about the institution. Student achievement is at a level appropriate for the degree awarded.
OVERVIEW
Description
Institutional Research
The Office of Institutional Research (OIR) supports inquiry into educational effectiveness by conducting our annual senior survey, for which it compares Wesleyan students’ responses those at peer institutions and regularly reports trends in satisfaction rates to the President’s Cabinet and Board of Trustees. OIR also conducts homegrown surveys addressing local issues, monitors retention and graduation rates, assists with projects focused on raising persistence of student subpopulations, reports on grade distributions by major and division, and responds to other data requests as they arise. Within OIR, the Associate Director of Assessment (ADA) works with three to five academic units each year. Most often, this work entails conducting interviews or focus groups with students in a major or minor. Since 2016, she has done this for eleven units, including two preparing self-studies for external review. A data wall between Academic Affairs and the ADA allows academic units to feel they can use this service to identify and address issues without fear of administrative reprisal. The ADA also works with other offices on campus doing assessment work, leads her own projects on topics relevant to general education, maintains an assessment website, and runs an assessment lab that employs student researchers.
Academic Units
Unit chairs publish learning goals describing what they hope their majors will be able to know or do by the time they graduate. Chairs submit an annual report to Academic Affairs in June that summarizes their unit’s assessment activities in relation to those goals. Each fall, the ADA responds to these reports. In the AY20-21 reports, reviewing student capstones was the most common means of assessment (13 units). Other notable methods of assessment include interviewing majors (7 units), conducting formal and informal focus groups with majors (5 units), surveying students with unit/field-specific questions (5 units), reaching out to alumni to learn about long-term outcomes (5 units), and monitoring grade distributions (5 units). Two units—the College of Letters and the College of Social Studies—have their students complete comprehensive exams reviewed by external evaluators.
We encourage academic units to view assessment as a way to collect systematic information to inform curricular, programmatic, and policy changes. For example, Neuroscience & Behavior compared the grades of two different sets of students who had taken the major’s gateway course: (1) those who took both Principles of Biology I and General Chemistry in their first year and (2) those who delayed taking General Chemistry until sophomore year. Finding no significant difference in their grades, NS&B faculty are now more flexible in the advice they offer first-years regarding when they should take these classes. This gives students, regardless of their high-school background, access to the major. Meanwhile, interviews with History majors confirmed suspicions that the major’s organizational structure around “modules” was confusing to students and did not result in curricular cohesion. The faculty thus redesigned the major requirement in a way that steers students to take a certain number of courses at each of the three course levels (100+, 200+, 300+…). In Chemistry, where students in Integrated Lab earn a “Chemical Hygiene and Safety Badge,” through which they complete “challenges” (e.g. conducting safety inspections in active labs, etc.) that certify their knowledge and agency regarding safety issues in chemistry laboratories, the faculty conducted a survey of majors. Badged majors, relative to the non-badged, were more confident in their safety knowledge and more willing to take action if they witnessed safety violations. The outcome of this study has reinforced the department’s plans to introduce more activities related to lab safety earlier in their curriculum. Finally, focus groups conducted with majors in the College of East Asian Studies (CEAS) revealed that CEAS’ study abroad requirement prohibited many students (STEM, winter athletes, Posse Scholars, FGLI students) from majoring. As a result, CEAS has changed its strategy; while its faculty still strongly encourage all majors to study abroad, they no longer strictly require them to do so.
Institutional Competencies
Ten years ago, we expected our students to develop the “Ten Essential Capabilities” by the time they graduated. But in our 2012 self-study, we observed that “most students and faculty do not view the Essential Capabilities as particularly useful for helping students achieve coherence in course choices or with regards to assessment of student performance.” More recently, Academic Affairs shifted from the lengthy Capabilities to the simpler MEME, a set of four broad competencies: Mapping, Expression, Mining, and Engaging. Academic Affairs then worked with Student Affairs to adjust the MEME so that the staff in the latter could use it to guide their work. Since its inception in 2018, the MEME has become a flexible heuristic intended to shape the conversations we have on campus, while offices across the university can adapt it to suit their needs. Two examples of such adaptation are how Residential Life has tweaked the language to make it more accessible for the student staff who support the residential curriculum (see Std 5) and how the Gordon Career Center used it in its design of Ideals into Practice (described below).
Appraisal
OIR’s hiring of an ADA in 2016 has resulted in fruitful assessment collaborations between the office and various academic units. While some units do not engaged much with OIR, we believe meaningful assessment only occurs when faculty and staff have real questions about the student experience and are primed to answer them. The ADA thus focuses helping motivated faculty ask and answer those questions. Our new external review protocol pushes units preparing self-studies to consider student- learning outcomes, so we expect to see more units do assessment work in years to come. Meanwhile, almost all academic units now publish learning goals—41 of 43 at last count—and we have streamlined the publishing process so what appears in the Wesleyan Catalog feeds to each academic unit’s website (see Std 9). This ensures that goals: (1) remain in stable locations as different faculty serve as unit chair; (2) are easy for students to find as they consider which major(s) to declare; and (3) play a more centralized role in the conversations faculty have about their students. Finally, the new assessment website allows us to publicize our assessment work, something we have not done regularly before.
Academic Affairs’ articulation the MEME in 2016 paired competencies with units on campus that would be responsible for their assessment: the new IDEAS minor (Mapping), the Shapiro Writing Center (Expression), the Quantitative Analysis Center (Mining), and the Fries Center for Global Studies (Engaging). This was a strategic move to link institutional competencies with institutional structures. But these centers are busy, most lacking time to do extensive assessment work (the QAC is one exception). Also, to say that a specific center is “in charge” of assessment in each area is unclear. Are they assessing the outcomes of students who pass through their centers (by taking a class, etc.?) or are they assessing student outcomes as they are more generally distributed? As a result, assessment of general education is the primary role of the ADA, not these centers. This is not necessarily a problem, but it does reveal slippage growing between the MEME and the institutional structures that inspired it. Meanwhile, though we have moved to a simplified articulation of institutional competencies, exchanges on the faculty listserv and in committee meetings reveal that some faculty feel that the MEME came “down” from the administration with little faculty input. So, while the MEME has helped the ADA organize her time and work, it has had minimal traction among the faculty themselves. Finally, while Expression, Mining, and Engaging are all competencies that faculty, students, and staff can understand, Mapping has been difficult for everyone, including the ADA, to operationalize. We have thus not included in our discussion of learning outcomes below.
RETENTION & GRADUATION
Description
Wesleyan has high retention and graduation rates among its traditional undergraduates (see Data Form 8.1). Our one-year retention hovers around 95%, except for the cohort that entered Wesleyan in Fall 2019, whose retention was affected by the pandemic. Over the last ten years, our 4-year graduation rate has been between 85% and 92%, excluding the cohort that entered Wesleyan in Fall 2017 (the Class of 2021), whose much lower 4-year graduation rate of 81% was also clearly pandemic-related. Our 6-year graduation rates typically sit between 90% and 94%. We do see some differences in graduation rates by students’ gender and race/ethnicity, with men’s rates being several percentage points lower in recent years. By race/ethnicity, Black and Latino rates show more volatility, ranging from the upper-80s to upper-90’s, while graduation rates for Asian students’ surpass all other groups. Our Bachelors of Liberal Studies program is too new and the sample size is too small for us to make claims about the graduation rates for students enrolled in it. Meanwhile, in our BA/MA programs, the percentage of students who graduated within the 150% time standard varies by the year we admitted them. For the cohorts that entered our programs between 2016 and 2019, these percentages hovered between 86% and 100%. In our MA programs, these percentages were between 73% and 100% and in our PhD programs, between 56% and 79% (see Data Form 8.4)
Appraisal
While are our undergraduate retention and graduation rates for traditional-aged students are generally high, like many schools, both were impacted by the pandemic. While it is easy to see that impact as a temporary blip, we are mindful that there are longer-term consequences for some students, particular those who took a semester off. Student Affairs’ class deans have always observed that students who take leaves of absences struggle to catch up when they return because the classes they need are only offered once a year. Hence, off-cycle students—and there are more of them now because of the pandemic—are likely to see their academic progress delayed even further once they return. Meanwhile, our visceral sense is that our graduation rates for our graduate programs are strong, but we lack the comparative data to know for sure.
GENERAL EDUCATION
Description
The senior survey provides us with trend data related to students’ general educational experience. Over the last five years, students were “generally” or “very satisfied” with the following: level of intellectual excitement (93% to 97%), opportunities for personal growth and development (86% to 92%), quality of advising in the major (79% to 82%), and course availability (76% to 85%). Quality of instruction in the natural sciences and math (77% to 84%) sits below that for humanities and the arts (93% to 96%) and the social sciences (92% to 97%). Overall satisfaction with Wesleyan ranged from 88% to 90%. Meanwhile, in 2021, 75% of students completed their general education expectations. When students do not complete these expectations, it is usually because they did not complete three courses in Division III (STEM). The Registrar announces the completion rates for these expectations at the final faculty meeting of the academic year. The current rate has not resulted in the faculty proposing any changes to policy around general education expectations.
The Registrar also publishes the number of students majoring, minoring, or earning a certificate in each field of study. Popular majors include English and Film (Division I), Economics and Government (Division II), and Psychology and Neuroscience & Behavior (Division III). Popular minors/certificates include Data Analysis, Chemistry, Integrated Design, Engineering and Applied Science (IDEAS), Education Studies, and Writing. Academic Affairs reviews major distributions, along with enrollments in courses within majors, when considering how to grant new hiring lines, although they do not base such decisions solely on such data. In Spring 2021, Division I asked OIR to present data on patterns in doubling majoring. The presentation highlighted the rising percentage of students who double major—from 23% in 2000 to 44% in 2020—and Wesleyan’s high percentage of double majors relative to peer schools.
In 2018, the provost presented data to the faculty on grade distributions on campus. Almost 64% of grades awarded from Fall 2016 to Spring 2018 were A’s and 31% were B’s; only 5% were lower than a B. Division I was more likely to award As than the other two divisions (72% As versus 61% and 59%). Division III was more likely to award A+s. Visiting, part-time faculty were somewhat more likely to grade “higher” than other faculty. Notably, at the beginning of the pandemic, the number of A’s increased, as faculty loosened expectations when the university abruptly pivoted to remote learning and altered policies concerning credit/unsatisfactory courses. Grades regressed in Fall 2020 and Spring 2021, but not back to pre-pandemic levels. Grades during AY20-21, when Wesleyan offered both remote, in-person, and hybrid courses, did not differ by instruction modality. The percent of A’s was also higher during our winter and summer session courses.
Appraisal
The completion rates for our gen-ed expectations suggest that most of our students take a wide variety of courses while on campus. However, we organize these expectations around our three divisions because that is how we organize ourselves administratively, not because we our faculty necessarily agree about how that organization represents the breadth of knowledge and experience we hope for our students. Furthermore, the wide variation we see in the distribution of majors reflects the complex relationship between how we admit our incoming cohorts, how faculty and class deans advise them, and how external market and parental pressures shape their worldview and academic choices. We lack a clear way to know whether our students end up in the majors that they “should,” since we also lack any way to define a good student-major match. Meanwhile, our high percentage of double majors, while perhaps reflective of our eclectic student body, is just as likely a sign of students’ desire to find structure in the open curriculum and/or students’ responses to competing exogenous pressures that they face. Furthermore, some of our students may be better poised to take advantage of the open curriculum and that we have not properly interrogated how the changing student population might (and should) change our strategies for pre-major advising.
Regarding our grade distributions, the high percentage of A’s we see is notable. But the national literature gives us pause. Perhaps our students’ grades are a sign of actual grade inflation, but maybe those A’s are the results of strong teaching and a strong academic support system (see Std 5) to help students who might otherwise fall behind. Certainly, our grade distributions flow from our institutional policies, like the open curriculum, which makes it easier for students to avoid classes in which they may struggle and generous late-withdrawal policies that keep lower grades from ever appearing on a student’s transcript.
STUDENT LEARNING
Description
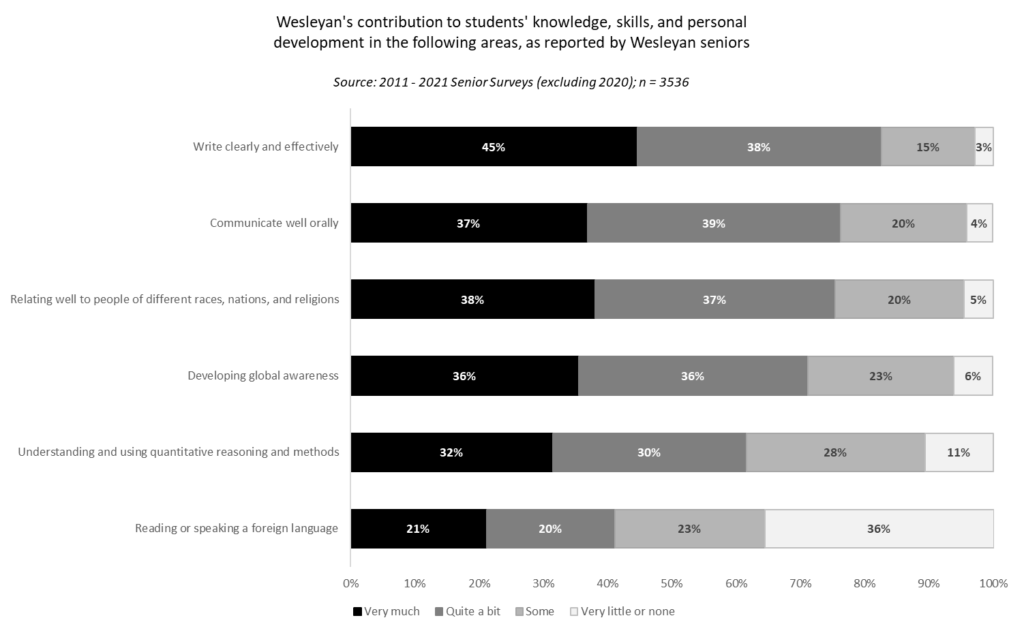
The senior survey asks students to report on how much Wesleyan contributed to their knowledge, skills, and personal development in multiple areas. Since this survey must accommodate the needs of many institutions, these items do not perfectly align with Wesleyan’s MEME competency framework. However, we can cautiously match at least some of the survey items to this framework. Under expressing, we can fit “writing clearly and effectively” and “communicate well orally.” We can fit “understanding and using quantitative reasoning and methods” under mining and under engaging, “relating well to people of different races, nations, and religions,” developing global awareness,” and “reading or speaking a foreign language.” When we aggregate the last five years of senior survey data, we see that students most felt the impact of their Wesleyan education on their ability to “write clearly and effectively” and “communicate well orally.” Other items had less impact, although still a reasonably substantial one, apart from “reading or speaking a foreign language.”
Expression
We define expression in the MEME as “the ability to express thoughts, ideas, and emotions to others effectively and concisely through a variety of mediums and modalities.” About 83% of seniors from 2011 to 2021 reported that Wesleyan had contributed “very much” or “quite a bit” to their ability to “write clearly and effectively; 76% reported the same for “communicating well orally.” Most recently, we have focused on assessing writing. While we do not require students to take a First Year Seminar (FYS), we have increased the number we offer, and the percentage of first-year students who take one has also increased from 40% in AY12-13 to 83% in AY20-21. Hence, understanding what students gain from FYSs, one of our almost universal curricular components, is important. In recent years, we have twice surveyed FYS students about their experiences and conducted an in-depth study of a stratified random sample of first-years students to learn about how they settle into college writing. We have learned several things from these projects. First, feedback is especially important for first-year students, many of whom come in Wesleyan ambivalent about their writing. They have may excelled in writing in high school, but they realize that what passed for “good” writing in high school may not at Wesleyan, causing them to look for faculty feedback early and often. Second, while students want feedback, some may not get enough; 16% of students in our 2019 survey reported that they had not received feedback from their professor on drafts of papers they had submitted in their FYS. About the same percentage reported not having had a one-on-one conference with their FYS professor. Third, some first-year students report having expected more exposure to writing in their courses than they received. In some cases, what they meant by “more” was more frequent writing assignments throughout the semester of a course; they seem surprised by courses where they may simply have one large writing assignment at the semester’s end or a few papers scattered throughout. In other cases, students appear to have minimal writing assigned during their first year throughout all of their courses. For some, the FYS may be the only writing intensive course they have. These students may have schedules filled solely with large introductory courses in some of our highest-demand majors.
In Spring 2018, Wesleyan began offering Calderwood Public Writing Seminars, which require an intense feedback process that helps students practice writing for non-academic audiences. In 2019, we assessed the written work from students in these seminars. Six faculty read pieces assigned to them, scoring them using two rubrics, and finding that late-assigned last drafts presented somewhat better writing than early-assigned first drafts. The differences did not arise to the level of statistical significance for most rubric items, but we suspect this was because of the small sample size (48 papers). Meanwhile, content analyses of Calderwood students’ reflections revealed that these seminars have provided students with an unparalleled peer editing experience. Our Calderwood Alumni Survey confirmed this finding.
Communicating well orally also fits under the MEME’s “expression.” Senior survey results reveal variation in how much Wesleyan has helped students to develop this skill. When we grouped students’ responses by major and then grouped majors by division, we found that within Division 2, the percentage of students reporting that Wesleyan contributed “very much” or “quite a bit” to their ability to communicate orally ranged from 73% to 88%. For Divisions 1 and 3, the range were slight broader and lower, 69% to 86% for Division 1 and 61% to 87% for Division 3. Our conclusion: in some majors, regardless of division, students get plenty of practice with their oral communication skills. In others, they get less, although all majors represented had more than 60% of students reporting “very much” or “quite a bit.”
Mining
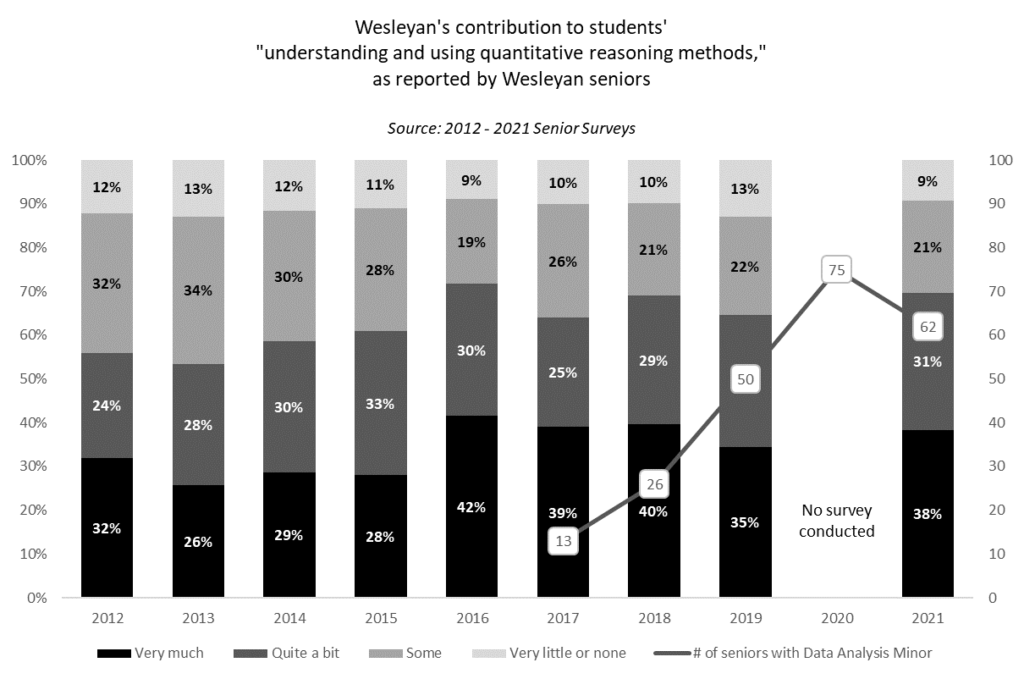
We define the MEME’s “mining” as “the ability to use logical and empirical reasoning and methods to explicate, analyze, and quantify one’s material and social realities.” Early on, we mainly viewed mining as students’ ability to perform quantitative work. In 2021, 69% of seniors reported that Wesleyan had contributed “very much” or “quite a bit” to their quantitative skills, compared to 56% in 2012. This increase parallels the launch of the Quantitative Analysis Center (QAC), which runs a series of courses, a well-attended summer program, a minor in Data Analysis and a certificate in Data Science. While many of our majors contribute to students’ quantitative skills, the QAC reaches a set of students who do not typically major in these fields. Furthermore, the QAC’s project-based, introductory statistics courses have proven more attractive to underrepresented minority (URM) students than traditional statistics courses, suggesting that the QAC plays an important part in diversity the set of students who graduate from Wesleyan with quantitative skills.
Since 2016, we have expanded our understanding of mining to include other kinds of analysis and reasoning, like students’ ability to locate and determine the relevancy and trustworthiness of source materials. On the FYS survey mentioned earlier, about a third of students reported that they did not write a research paper “requiring library resources, primary documents, or other material external to regular course content” in their FYS. Almost half of these students reported that their FYS did not address how to locate library resources; over half reported that their FYS did not address “how to determine which library resources are most relevant for a specific research project,” and or “how to evaluate the credibility of websites and new media that might be used for a research project.” Admittedly, our current statement on FYSs does not require faculty to teach library research skills or assign research projects. But if Wesleyan students do not start learning about library research in their FYS, where do they? Anecdotes from students enrolled in the Patricelli Center’s Engaged Projects course, which requires students to conduct research prior to beginning their projects, reveals striking cases of students, often juniors and seniors, reporting that they had never conducted this kind of research before. Furthermore, in the 2018 senior survey, when asked a special set of questions about library use, 37% of responding seniors said that they had not been in a library-led class session on how to find information. Perhaps the need to provide explicit instruction on how to use a library database is not as pressing as it once was. But we do wonder whether students receive strong, consistent guidance on how to prioritize search results provided by these tools and integrate what they find into their work. In a time of “fake news,” we may need to attend more to how our students evaluate resources outside of what the library has curated for them.
Engaging
We define engaging in the MEME as “the ability to comprehend, appreciate, and negotiate human and cultural differences and the complexity of one’s own relation and accountability to wider sociohistorical dynamics.” On the senior survey, over the last ten years, students reported that Wesleyan had contributed “very much” or “quite a bit” to the following items related to this competency: relating well to people of different races, nations, and religions (75%), developing global awareness (72%) and reading or speaking a foreign language (41%). A trend analysis of this last item reveals a moderate increase over time in the percentage of graduating seniors who report Wesleyan contributing “very little or none” to their ability to read or speak a foreign language. The lower percentage we see for foreign language skills is no surprise because Wesleyan lacks a universal language requirement. Instead, students complete foreign language courses for personal enrichment, because their major requires them (for example, CEAS, COL, and Art History), or to complete Wesleyan’s requirement for foreign language study prior to studying abroad. Still, we are proud of the variety of language study options we offer for interested students and the course-level assessment mechanisms many of our language faculty use (see E-Series). Some Wesleyan faculty have expressed concern about a possible decline in language study, citing the national trends in this regard and wondering whether such a decline may have been accentuated by Wesleyan’s shift from a two-course to a four-course summer registration for incoming students, which minimized pre-major advisors’ influence on new students’ course selection. But when Academic Affairs recruited faculty to advise a randomized subset of incoming students over the summer of 2018, the experiment did not boost language enrollments. This may be because, while the percentage of first-year students enrolled in a language course declined slightly from ten years ago, that decline began before our switch to four-course summer registration, after which it has remained flat.
Appraisal
The National Institute for Learning Outcomes and Assessment (NILOA) describes four assessment philosophies emergent across higher education: teaching and learning, measurement, compliance and reporting, and student-centered. We situate ourselves within the first and last. Regarding the first, we have fed the results of our work on expressing and mining into pedagogical workshops for faculty. For example, we have used data from our examination of first-year writing in our Faculty Seminar in the Teaching of Writing and with faculty participating in our FYS Teaching Seminar Series. With the pandemic, we have seen increased faculty interest in attending pedagogical workshops and in hearing about the student experience and so we expect to have more such opportunities to use data inform faculty members’ teaching. As noted in Std 7, library staff are also working to bolster their relationships with faculty so that faculty are knowledgeable about what the library can do for their students and want to do so in a way that is both sustainable with minimal staff and impactful in the context of an open curriculum. And we should note: the open curriculum makes it difficult to assess these competencies or to close the loop on any assessments that we do. We do not have required courses in which we can implement assessment projects, nor can we impose curricular or pedagogical changes in response to what we learn from these projects. With no appetite to change the open curriculum, our approach assessment of learning outcomes, especially regarding these competencies, is inevitably piecemeal and bottom-up.
Concerning NILOA’s student-centered philosophy, some portfolio initiatives have emerged on campus that offer structured opportunities for students to engage in self-assessment. A few majors and minors (Religion, Global Engagement, IDEAS) require students to submit portfolios as part of their completion requirements. Meanwhile, university-wide portfolio initiatives have also emerged. The Integrative Learning Project (ILP), offers two half-credit courses where students build e-portfolios that are reviewed by external reviewers. Ideals into Practice (I2P) offers a .25 credit course that students can enroll in each academic year and through which they are encouraged to add to their e-portfolios in six competency areas. We market these latter two initiatives to all students, regardless of their academic interests. While we find them promising, enrollments are still relatively low (49 students in Ideals into Practice and 162 students in the Integrative Learning Project), and it is unclear how to boost them.
Finally, given its placement in our new strategic plan, we know that one area to which we need to commit more attention is how to assess our students’ experiences with civic engagement. The ADA and Director the Jewitt Center for Community Partnerships have met repeatedly over the years to discuss how they might do this. We certainly collect data about civic engagement on campus (how many students participate and how), but we don’t have a good way to understand the outcomes of their experiences, nor how to access what students might be doing and learning outside of the programs that the Jewitt Center oversees.
STUDENT EXPERIENCE
Description
Academic support
Wesleyan offers many well-received academic support services (see Std 5), earning an 85% – 90% satisfaction rate for “availability of academic support and assistance” on the senior survey. Our success may come from how our staff use data to amplify the services they provide. For example, when Student Academic Resources (SAR) moved from a gate-keeping to an open system through which any student could request a tutor, the 262 requests the office received in AY2015-16 grew to 497, 683, and 773 in the subsequent three years. This made it more difficult to match tutors to tutees. The lower match rate (88% in Fall 2018, down from 95% the previous fall) caused SAR to shift to group tutoring and delay when students can request a tutor until a few weeks into the semester, after they have a better sense of which courses will challenge them and are more aware of course resources. These changes raised the match rate (96% in Fall 2019), improving service utilization, as measured by whether matched tutors and tutees actually meet and total tutoring hours students received.
Career support
Before the Gordon Career Center (GCC) adopted Handshake, their career management platform, in 2016, about half the Wesleyan students engaged with the GCC online. Now about 90% do, and we have also seen a statistically significant increase in satisfaction for Career Services from the year prior for the last three years, from 53% in 2017 to 66% in 2021. Despite these numbers, GCC leadership still worried that too many students perceive the office as unwelcoming, resulting in the Center asking OIR to take a “deep dive” into the satisfaction rates with the Center. Survey data collected in Spring 2019 revealed that satisfaction with the GCC did not vary by sex, status as a student of color or underrepresented minority, financial aid status, or GPA. There were, however, differences in satisfaction across cohorts with first-years being the most satisfied (88%) and seniors being the least (66%). Seniors’ satisfaction correlated with when they first engaged with the GCC, earlier contact resulting in more satisfaction. The Center has also explored what engagement looks like for different students, finding that BIPOC and FGLI students are no more or less likely than other students to use the Center. Future research will explore whether there are differences in when these groups first visit the GCC, since this is an important predictor of later satisfaction.
Results like this reaffirm the GCC’s continual efforts to offer programming that invites students to engage with the Center long before senior year. In 2017, OIR, in collaboration with Psychology and with input from the GCC, surveyed incoming students about their interests in five broad professional fields: mental health (38%), education (36%), law (34%), medical health (27%), and engineering (20%). This confirmed a general sense that there was a significant interest in the mental health professions among our students. A follow-up survey of 216 students who identified themselves as having this interest explored which clients the students hoped to serve and in what settings they imagined working. This information allowed the GCC and Psychology to offer more customized programming for these students.
Pre-major advising
Most notable is our relatively low satisfaction with pre-major advising, a concern for much of the last two decades. From 2001 to 2020 only between 47% and 63% of seniors reported that they were “very satisfied” or “generally satisfied” with pre-major advising. To learn more about the issue, in Fall 2021, we surveyed both the faculty and students about their experiences with pre-major advising. One thing we learned from these surveys was that there is a conflict of expectations between faculty and students regarding pre-major advising. Students are more likely to lean into “credentialist” activities, like knowing the requirements for a major, while faculty are more likely to embrace “generalist” activities, like exploring academic areas outside of one’s comfort zone. Meanwhile, both faculty and students complain that it is difficult to find clear, concise information about university and unit-level policies on the university website, which is highly decentralized (see Std 9), and many find the course registration process confusing. Finally, the structure of Wesleyan majors—number of prerequisites, limited courses offered off-cycle (see above)—and the existence of general education expectations are required for some majors and for being eligible for honors, causes some students to feel that the open curriculum that Wesleyan sells to prospective students does not feel so open when they begin to explore.
Diversity, Equity and Inclusion
The senior survey has consistently revealed disparities in satisfaction across subpopulations of students. In 2021, students from underrepresented groups were less satisfied than white and Asian students on climate for minority students (46% vs 71%), ethnic/racial diversity of the campus (46% vs 67%), quality of instruction in NSM (71% vs 86%), health services (72% vs 88%), and out-of-class availability of faculty (87% vs 96%). The continued existence of these disparities in our data have inspired our recent work addressing diversity, equity, and inclusion on campus including the creation of the Resource Center, the expansion of First Things First, the re-introduction of a first-year cohort in Malcolm X House, the creation of Math Jam to help underrepresented students with their math skills, and workshops to train teaching and course assistants in inclusive teaching practices (see Std 5).
Conversely, the senior survey reveals no statistically different gaps between international students regarding their overall satisfaction with their Wesleyan education (87% versus 88%) or their willingness to encourage a similar student to attend (83% versus 79%). One of the few statistically significant gaps regarded pre-major advising; 78% of international students were satisfied, but only 52% of domestic students. Similarly, 100% of international students were satisfied with the availability of academic support and assistance, but only 85% of domestic students. International students were, however, less satisfied with food (70% versus 88%) and student government (28% versus 61%). Viewing our international student population as one with unique needs, in Fall 2021, we fielded our first International Student Survey. These students were most likely that they were only “somewhat” or “rarely or never prepared” to manage academic stress (1st semester students: 22%, all others: 38%) and visiting professors’ office hours (1st semester students: 42%, all others: 26%). Also notable: 57% – 65% of 1st semester students were “not at all aware” of the requirements for off-campus employment (e.g. OPT, CPT). Given that the employment potential often shapes what majors these students will declare, getting this knowledge into the hands of younger students early is imperative.
The Pandemic
Finally, it is important to touch upon how we used data to support students during the pandemic. We repeatedly asked both faculty and students how they were experiencing life on campus during the pandemic, conducting three rounds of surveys of both the faculty and students, from Spring 2020 to Spring 2021. After each survey closed, OIR presented the results in an open Zoom meeting for all faculty and published the slide decks on the provost’s web page. Additionally, in Fall 2020, OIR sent detailed data to offices charged with supporting faculty’s classroom and pedagogical needs. In Spring 2020, we learned how difficult the semester was, especially for our students. 40% of students who took the survey rated remote learning as “poor” or “awful.” It was particularly difficult for our FGLI students and our female students to move home and successfully continue their coursework. They reported struggling with finding quiet places to work, accessing consistent Internet, and balancing their coursework with the needs of their families and their own physical and mental health. 39% of students reported that they had fallen short on at least some of the learning goals in one or more of their courses. As we began planning for Fall 2020, these insights informed the administrative decision to offer a residential experience for most students and to design support mechanisms for students who needed to study remotely. In Fall 2020, our surveys helped us understand which classrooms had problematic technology for hybrid courses, how remote students were struggling relative to those on campus, how on-campus students needed spaces outside of their own bedrooms to complete their academic work, and the extent to which our students were facing mental health issues and why (e.g. lack of social interaction, state laws prohibiting remote therapy sessions, etc.). The findings of these surveys resulted in increased support for teaching and course assistants for faculty, expanding access to mental health resources for students, and better communication to students about where they could reserve study spaces.
Appraisal
The above examples demonstrate the varied ways in which we use data to better understand and improve the student experience. We are proud of these efforts and believe they show our commitment to improving our services. We do, however, face several significant challenges. The intense pressure to support every decision with data has caused in an increased desire in surveying our students. This, coupled with a new generation of students who feel less obligated to check and respond to email, has dampened the response rates of all of our surveys, including the senior survey and our teaching evaluations. Second, as noted in Std 2, the campus has increasingly turned to Software as a Service (SaaS) options to support campus operations. These, coupled with the shadow databases maintained on the desktops of staff with their own data interests, have generated an increasingly complicated network of data systems that are not always synchronized, sustainable, or easy to report from. Hence, the projects described above take an immense amount of labor across multiple offices.
OUTCOMES
Description
The Gordon Career Center publishes the results of the first destinations survey it conducts for every graduating class. The knowledge rate for the survey is usually in the high 80s to low 90s. In the Class of 2019, 12% of students were still seeking employment or graduate school admission six months after graduation. For the Class of 2020, it was 21%, due in large part to students pursuing positions in industries where hiring was particularly hard hit by the pandemic, such as the arts, nonprofits, and education. In the last six years, graduates reported working in the following fields: education (10% – 17%), tech/engineering/sciences (7% – 15%), financial services (10%- 13%), leisure, arts & entertainment (6% – 16%), media and communications (7% – 14%), and consulting (8% – 13%). Meanwhile, over the last five years (2016 – 2020 entering classes), acceptance rates at US medical schools for Wesleyan applicants has ranged from 55% to 77%. While our method for calculating these percentages may be different from other schools, it is worth noting that the national average is 41 to 44%. Over the last five years, acceptance rates at US law schools for our graduating seniors have ranged from 92% to 100%. For four out of the past five years, the rate was 100% for seniors. For post-graduation applicants, the five-year rate has ranged from 87% to 93%. NSF data from 2017-2019 doctoral earners suggest that 8.7% of our graduates go on to earn PhDs in science and engineering, placing us 14th among our peers of similar institutional size.
Our survey of exiting graduate students reveals that 57% of our Ph.D. students reported that they would be working in a position in their field after graduation, relative 28% of MA students and 25% of BA-MA students. Meanwhile, 45% of Ph.D. s students reported that they would be working in a field in their industry, relative to 33% of MA students and 35% of BA-MA students. About 48% of our exiting MA students reported they would be attending a Ph. program after graduation, and 28% of our BA-MA students.
Appraisal
Wesleyan’s launch of the College of Education Studies was in part a response to the knowledge that many Wesleyan alumni work in education (22% in our 2017 alumni survey). This is just one example of how knowledge of alumni outcomes has shaped the our curriculum. But while we are interested in the outcomes of our graduates, we cannot understate how challenging it is to collect reliable data about them. GCC data captures students’ employment status within nine months of graduating. It does not tell us where our students land years later, when we might be most likely to see the impact of a liberal education. But our attempts via surveys to gather data from older alumni are stymied by low response rates. While our response rates on alumni surveys have always been low (e.g., 34% in 2017), for our 2020 alumni survey, it was abysmally low (11%). Some of our academic units do their own work to gather data from alumni (see E-Series), but these efforts are scattered and unstandardized. Furthermore, while we acknowledge the public’s interest in the salaries of alumni from institutions like Wesleyan, we also question the reliability and validity of such data and are cautious about using it. Alumni resist answering questions about their salaries, so our internal data is spotty. Externally, the College Scorecard relies solely on the tax data from students who received financial aid. Meanwhile, as a school that recruits and graduates many students who are committed to promoting social justice in both their lives and careers, we are wary of celebrating high incomes as the single sign of post-graduate success.
We also want to highlight the challenges our FGLI and international students face when declaring their major. As studies show, FGLI students are often under immense pressure to undertake courses of study that have clear pathways to careers; the same is true for international students who wish to remain in the US after graduation, as federal regulations require them to accept jobs that are closely aligned with their majors. While Wesleyan has long embraced a philosophy of agnosticism regarding the relationship between majors and career trajectories, the reality is that many of our students will not or cannot abide by that philosophy and simultaneously fulfill their familial and financial obligations. Given the institution’s admirable commitment to recruiting and increasing the number of low-income and international students, we see a need for the campus to have a larger reckoning among the faculty and staff about how we talk about the relationship between majors and careers.
PROJECTIONS
- Academic Affairs will respond to the report issued by the Ad Hoc Committee for Pre-Major Advising that worked in AY21-22. We anticipate changes to how we provide advising for incoming first-year students in the summer before they arrive at Wesleyan, intentional matching of advisors to advisees based on advising expertise and student need, and streamlined distribution of information on major and university policies.
- We will continue to explore the implications of a rising number of international students on how advising philosophy be encouraging collaborations between Academic Affairs, the Office of International Student Affairs and the Gordon Career Center.
- OIR will continue to look for opportunities to insert data about student learning outcomes into faculty conversations (in pedagogical workshops, at department meetings and divisional lunches, etc.).